Finding Structure in Users’ Evolving Listening Preferences

At Spotify, we invest into designing recommendation algorithms that allow users to explore the music space more effectively. Recent findings suggest that users’ preferences change over time, and that diversifying the users’ consumption might be important for long-term satisfaction. Therefore, to better serve users in the long run we need to understand how their long-term preferences evolve over time. In this work, we propose a model that explains how users’ listening preferences develop over the course of several years.
Evolving Preferences of Users
We compiled a dataset of 100,000 users who were continuously active during a four-year-long period (2016 to 2020). For each user, we considered their entire streaming history and grouped the streams by micro-genre and quarter. Each user's music consumption is summarised by the distribution over more than 4000 musical genres for each of 17 consecutive quarters. We then compared how the consumption distribution of each user changes from the first quarter Q1 of 2016 to the respective distribution of this user for each of the 17 subsequent quarters (Q2 2016 to Q2 2020). We use the total variation distance to measure the difference in distributions.
Figure 1 illustrates the histograms of the total variation across all users for each subsequent quarter. Darker colors correspond to the total variation distance for the quarters further apart from each other. The total variation in consumption tends to increase on average with time; the mean values of the respective histograms increase approximately from 0.4 to 0.6. This suggests that the users' preferences do indeed drift over time.
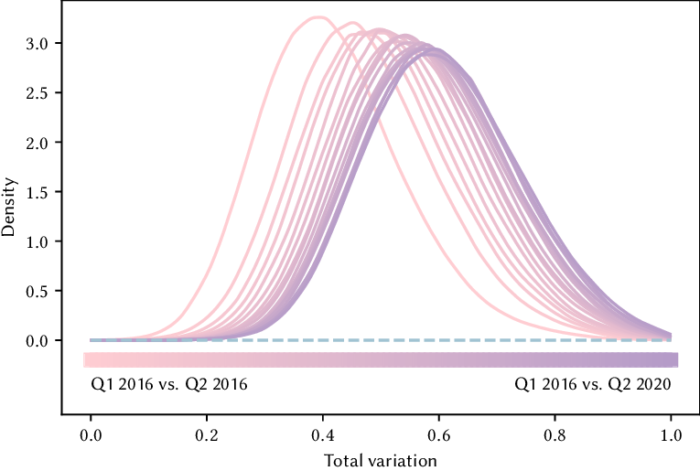
Figure 1: The total variation in consumption between Q1 2016 and each subsequent quarter increases (on average) with time.
Discovery Correlates with Conversion
As with many streaming services, Spotify users have an option of subscribing to the paid service. Alternatively, they can stay with the free ad-supported service that slightly limits their interaction. We demonstrate that users who diversify their consumption in musical genres are more likely to convert from the free to the paid subscription.
We consider a sample of users who registered on Spotify before January 2019 and were continuously active between March 1st and September 30th 2019. We ensured that half of the users in our sample converted to a paid subscription between October 1st and October 31st while the other half did not. We then split the listening history of every user into two parts. The first part corresponds to all streams between March 1st and August 31st (the baseline period). The second part consists of all streams between September 1st and September 30 (the test period). We looked into the fraction of genres that each user listened to during the test period that did not occur during the baseline period.
Figure 2 illustrates this fraction for each total number of different genres consumed by users. We can see that users with a larger fraction of new genres in the test period were more likely to convert, even when accounting for overall activity. This suggests that helping users discover music beyond their current preferences could improve their satisfaction for the long-term.
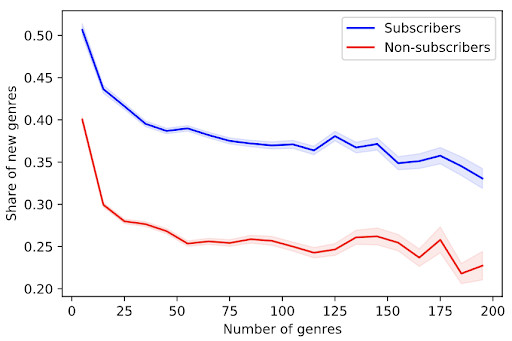
Figure 2: Proportion of new genres streamed in September 2019 (w.r.t. the period March 1st-August 31st 2019) vs. the total number of genres streamed in September 2019.
Preference Transition Model
To better understand how users’ preferences change over the years we develop a new probabilistic model: the Preference Transition Model (PTM). At the core of this model is a transition matrix that captures how user preferences change from one time step to the next (for our purposes, we define time steps to be quarters). Intuitively, for each user we define their preferences at a given time t as a 4000-dimensional probability vector representing the distribution of streams over micro-genres. By using sequences of preference vectors, we learn a linear model that regresses the preference vector at time t on the preference vector at time t-1. This model is parametrized by a transition matrix A that is easy to interpret. The element aij tells us how much listening to genre i at time t-1 contributes to listening genre j at time t. Figure 3 illustrates our approach.
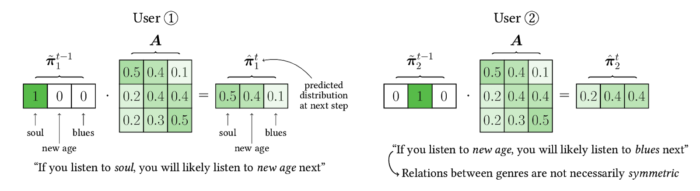
Figure 3: Sketch of our Preference Transition Model.
Empirically, we observe that factoring out activity is crucial in obtaining a good model. Even across quarters, overall activity can vary considerably and is best modeled separately from relative preferences across genres. See our paper for the full details of the model.
Predictive Performance
To measure the predictive performance of our model we consider several different prediction tasks: minimising the total variation between the observed and the predicted genre distribution, predicting whether the relative consumption of a certain genre increases from one time step to another, and finally, predicting the new genres the user would interact with relative to the previous time step or to the entire streaming history of the user.
On our dataset of Spotify streams, PTM outperforms all the baselines we consider (i.e., autoregressive poisson model, dynamic poisson factorisation, non-negative matrix factorisation, previous observation) on all tasks. We find that our model is particularly good at predicting new genres a user has never listened to in the past. We also apply our model to other publicly available datasets ranging from culinary preferences to movie preferences and find that our model performs favorably in these applications as well.
Structure in Long-Term Preferences
Beyond predictive performance, an important feature of our model is that the learned transition matrix A has an intuitive interpretation. If we imagine a graph with vertices representing the different genres, then the matrix A can be viewed as a weighted adjacency matrix. In other words, for any two connected genres i and j, the transition matrix gives us the probability of the user switching to genre j after listening to genre i. This interpretation allows us to think of the users’ temporal consumption as a trajectory in the genre graph. We can use this graph to answer the following questions:
Given two genres i and j what is the best connecting genre?
Given that the user has streamed genre i now, what is the most likely genre they would stream next?
Figure 4 illustrates a simplified example of such a preference transition graph with the shortest paths between the green and the red vertices. This example reveals fascinating insights about the world of music. For example, to go from classical to any music genre from the 20th century, our model suggests users go through late romantic era, bridging the gap between centuries of music. Similarly, to go from EDM to nu jazz or gospel (among others), our model suggests users pass through tropical house, an upbeat / relaxed type of electronic music.
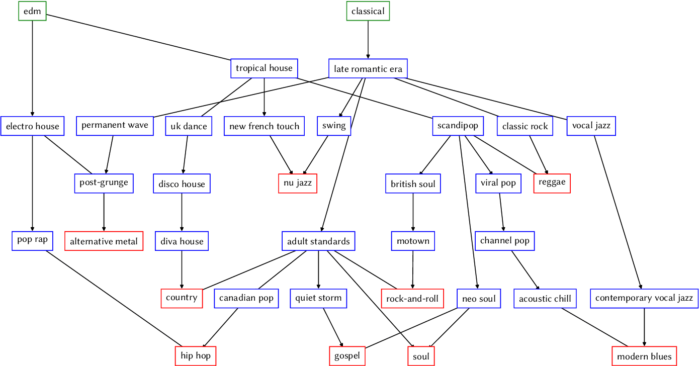
Figure 4: Shortest paths between source genres (in green) and destination genres (in red).
Our hope is that we could take advantage of these paths to gradually bring users to discover new regions of the music space. For example, if we want to bring a classical music fan to listen to country music, our model suggests intermediate small steps (late romantic era, adult standards) that could help bring them there.
For more insights about our model PTM and its potential, see our paper:
Where Next? A Dynamic Model of User Preferences Francesco Sanna Passino, Lucas Maystre, Dmitrii Moor, Ashton Anderson and Mounia Lalmas. The Web Conference 2021
SHARE THIS ARTICLE


