Understanding and Evaluating User Satisfaction with Music Discovery

If you’re a Spotify user, you may be familiar with Discover Weekly—your weekly, personalized playlist of music you’ve never heard before. Discovery is an important part of the music listening experience. But because music discovery is an incredibly personal and subjective experience, we have much to learn about users’ expectations for discovery, especially in the context of recommendations such as the tracks included in a Discover Weekly playlist.
Our research, “Understanding and Evaluating User Satisfaction with Music Discovery,” presented at SIGIR 2018, aims to provide insight into perceptions around discovery by looking at listeners’ feelings and habits surrounding their Discover Weekly lists. We use a mixed methods approach to try to understand users’ expectations with Discover Weekly, determine which interactions with the playlist could signal user satisfaction, and show how models of user satisfaction could be used to evaluate and optimize recommender systems.
Our approach
We decided to use a mixed methods approach in order to form a deep understanding of users’ motivations, so that we could develop evaluation metrics that we are confident measure the right things from the users’ point of view.
Our mixed methods work consisted of multiple studies in a sequential exploratory design, meaning we start with a qualitative study to explore the space, and follow up with quantitative studies to scale up the findings. In our qualitative user research study, we interviewed users to generate hypotheses about user satisfaction with Discover Weekly.
The subsequent quantitative data analysis and modeling validated these hypotheses at scale.
Qualitative analysis and hypotheses
We conducted 1:1 semi-structured interviews with ten participants, asking questions like “What do you expect from your discovery recommendations?” and “Describe how you typically listen” to progressively narrower questions such as “What is a good or bad set of recommendations for you” and “How do your behaviors change with good or bad recommendations?”
We analyzed the data from the interviews using an approach based on grounded theory, extracting themes about users’ goals, expectations, experiences, and behaviors. From here, we were able to develop three hypotheses to test at scale through analysis of user interaction data.
Hypothesis 1: Goals for discovery
We observed four common goals for listening to Discover Weekly, with different listening behaviors attached to each:
To play new music in the background of other activities (more streaming, less skipping);
To listen to new music in the moment, while also saving tracks to listen to later (streaming the playlist, saving tracks, adding tracks to playlists),
To find new music to listen to later (skimming through the playlist, saving and adding)
To engage with new music (artist and album page views, and “downstream listening” or listening to recommendations outside of the context of Discover Weekly).
This leads us to our first hypothesis: that on-platform behaviors provide clearer signals when they’re viewed within the context of the user’s goals. For example, a skip might mean something different for someone listening to music in the background than it would for someone saving music to listen to later.
Hypothesis 2: Context from individual habits
We found that users judged their playlists relative to previous weeks, and the level of engagement varied between users. For example, streaming five tracks could signal a “good” week for a casual user who typically streams one to two tracks per week, or a “bad” week for someone who typically streams 15.
Therefore, we hypothesized that metrics should be normalized relative to each user’s typical behavior, rather than assuming the same standards for all users.
Hypothesis 3: One great recommendation
Finally, users tended to approach their recommendations with the understanding that not every track would be a hit with them. That said, they generally hoped to find a new song or artist that they’d really love. The positive connotation of that hope seemed to outweigh the “risk” that they wouldn’t connect with any of their recommendations.
So, we hypothesized that just one great recommendation could have a large positive effect on satisfaction.
Quantitative analyses
Having completed qualitative research to generate three hypotheses about satisfaction with music discovery, we set out to validate these hypotheses quantitatively in data.
Validating our first hypotheses
In our next study, we used unsupervised learning on log data to investigate our hypothesis about user goals. Check out this heat map of behavioral profiles detected through clustering:
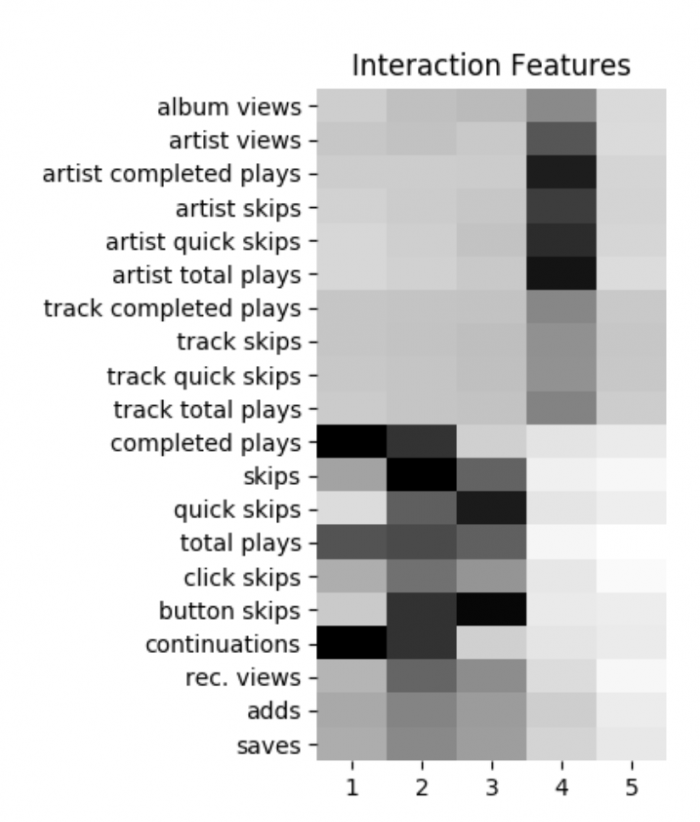
Cluster 1: consists of completed plays and few skips, corresponding to goal 1 (play new music in the background).
Cluster 2: consists of plays, skips, and saves, corresponding to goal 2 (listen to new music now and later).
Cluster 3: Users mostly skip and save (goal 3: find new music for later);
Cluster 4: Folks in cluster 4 listen downstream (goal 4: engage with new music).
By looking at the log data, we validated the first of our hypotheses from user research!
Validating our second hypotheses
In our next study, we leveraged findings from user research to propose and validate online metrics for evaluating our recommender system in A/B tests. Although behaviors differ according to users’ goals, certain behaviors were unambiguously positive, meaning users always mentioned them as signals of a positive experience, regardless of goal.
The unambiguously positive signals are:
saving or adding a track
viewing an artist or album page
and listening downstream.
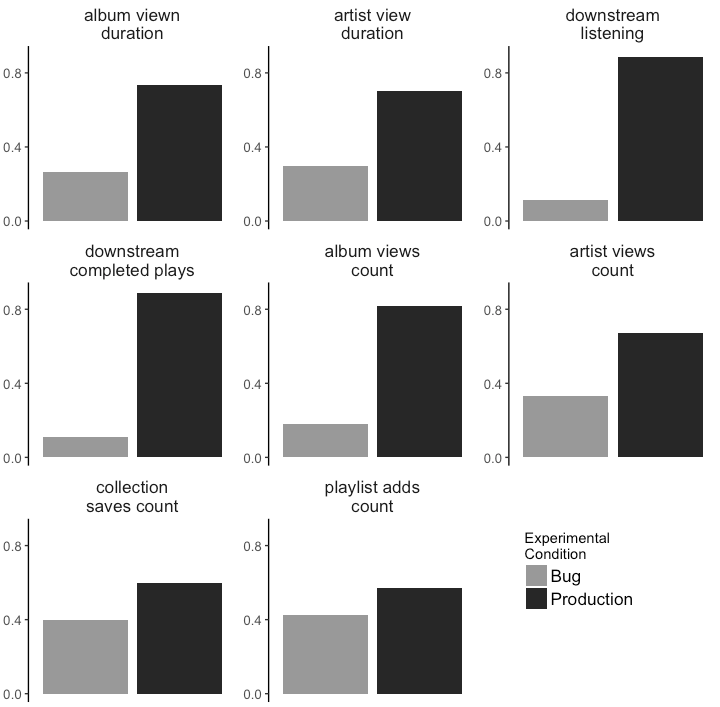
Check out how these signals differ between the production system, and a “degraded” version of the algorithm containing a bug. We observed significant differences between the systems, especially for the normalized versions of the metrics. Furthermore, we observed no significant differences in the A/A setting.
Thus, we confirmed our second hypothesis: that metrics should be normalized to each user.
Validating our third hypotheses
Next, we developed a modeled metric of satisfaction that can be used for offline evaluation and optimization. To train up a supervised model, we first needed ground truth on levels of satisfaction. We gathered this ground truth data via an email survey. The survey contained many questions that probed further on hypotheses from user research. Among the data we collected were labels on overall satisfaction and current week satisfaction. We received responses from about 18,000 users.
We joined the survey responses with interaction log data to produce satisfaction scores for each user and track, then trained a gradient boosted decision tree model against the survey responses.
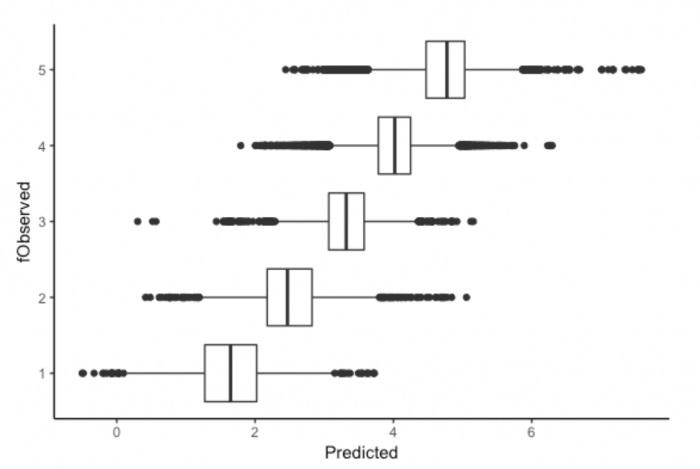
The results of the model
The x axis is the predicted values, and the y axis is the observed values; a perfect model would show a straight line going up and to the right. We see that the model is successfully differentiating between positive and negative experiences.
Cluster | Normalized | Max | Sum | |
|---|---|---|---|---|
Gain (%) | 70.6 | 15.4 | 5.6 | 2.3 |
Weight (%) | 54.1 | 30.7 | 7.5 | 1.0 |
And by examining the feature importance, we are able to confirm several hypotheses from user research. Clusters, or user goals, add the most information about satisfaction, confirming our hypothesis about users’ goals. Normalized features provide the next most information; validating that metrics should indeed take into account each user’s typical behavior. And finally, maximum interaction with a track over the course of the week provides more information than total usage.
This is in line with our hypothesis about “track love”—it just takes one great recommendation to make users feel satisfied.
Conclusion
Ultimately, we concluded that mixed methods were really valuable here: qualitative research provided clarity on users’ expectations and goals with discovery, while quantitative research confirmed our hypotheses at scale. And along the way, we learned a lot about what drives satisfaction with music discovery, and importantly, how we can measure and optimize for it.
SHARE THIS ARTICLE
